The Effect of a Program of Hormone Replacement, Low Glycemic Nutrition and Exercise Instruction on Select Outcomes Indicative of Disease Risk and Subjective Impression of Quality of Life in a Private Practice Setting.
Introduction
Testosterone supplementation (T) in men improves strength (1-4) and increases de novo protein synthesis as well as muscle mass (5-7). T has also been shown to decrease body fat (7-9) and particularly visceral body fat (8), increase libido in normal men (10) and increase libido and sexual performance in hypogonadal men.(11-13). Mood is also improved with T in both hypogonadal(14-15) and older community dwelling men(16). Higher endogenous testosterone has been correlated in many studies with a reduction in a number of cardiovascular risk factors, among them lower - blood pressure, total cholesterol (TC), LDL-cholesterol (LDL), triglycerides (TG), visceral body fat, waist-hip ratio (WHR), serum insulin, fasting and post-prandial glucose, higher HDL-cholesterol (HDL) and greater insulin sensitivity (17-23). In several studies where T has been shown to increase cardiovascular risk, levels of T achieved were supraphysioligic(24-28).
Levels of dehydroepiandrosterone sulfate (DHEAS) correlate inversely with depression(29-30) and supplementation with DHEA (D) results in improvement(31-35). D also directly stimulates immune responsiveness in humans(36) in animals(37)and in vitro(38,39). In men, D has been shown to improve body composition in some studies(40-42) but not in others(43,44). DHEAS levels have been shown to correlate inversely with hippocampal atrophy in the elderly(45) and D was shown in one study to improve memory in depressed patients of middle and older age(46).
Growth hormone deficiency (GHD) is associated with the following, all of which can be significantly reversed with replacement of human growth hormone (G): a decrease in lean body mass(47-51), bone density(52-58), skin thickness(59), sense of well-being(60-65), rate of wound healing(66-70), immune responsiveness(71,72),and aerobic capacity(73,74) . In addition, GHD is associated with an increase in the following, all of which have been reduced in clinical trials of G: (LDL) (75) , atherosclerosis (65,76-82), total body fat(47-51) , hospitalization rate and sick days from work(83).
The benefits of Estrogen replacement therapy have been well described in terms of reducing risk of coronary disease (79,84-88), osteoporosis (94-97), and Alzheimer's Disease (89-93).
There is evidence that progesterone (P) replacement therapy in both the perimenopausal and post-menopausal periods is effective in reducing risk of osteoporosis through osteoblast stimulation (98-100) .
A diet of low glycemic index (LGID) has been shown to lower LDL(101-103) and TG (104,105), raise HDL(105-107), improve both glycemic control(102,108) and insulin sensitivity in non-insulin dependent diabetes(109), and reduce coronary artery disease (CAD) risk in women.(110)
And certainly it is no surprise that physical exercise is capable of increasing muscle mass (111,112) decreasing body fat(111-113) and lowering the waist-hip ratio (WHR).(113) One well-published risk of GH therapy is an increase in glucose levels with associated insulin resistance.(114-118) One recent study showed improvement in insulin sensitivity in obese, insulin resistant individuals using GH along with a low calorie diet compared to a low calorie diet alone(119).
The above litany of benefits, many of which are attributable to, and overlap among several of the above potential interventions, are demonstrated in controlled clinical trials isolating one intervention and measuring one or more related outcomes. Our practice incorporates all of the above interventions in three categories: LGID, regular exercise and hormone supplementation.
Hypothesis
We hypothesized that applying these three modalities simultaneously to an uncontrolled private patient population where the subject is autonomous and compliance is variable will improve select outcomes of disease risk and in the subjective view of the patient, enhance quality of life. We further hypothesize that the tendency of G to increase insulin resistance and serum glucose will be offset by the LGID, exercise and perhaps some benefit from testosterone. We collected data on 78 men and 29 women on our program to determine how selected parameters of disease risk were altered. We measured the following outcomes related to disease risk before commencing and after 197 to 274 days on a program: HA1C, TC, LDL, HDL, TG, TC/HDL (CRR), TG/HDL, body fat percentage (%BF), WHR, bone mineral density (BMD), and prostate specific antigen (PSA) in men.
In our practice we have found that quality of life (QOL) issues are at least as important to our patients as longevity. The benefit of an aging control program should also include some means of measuring QOL. Since one's impression of his or her own QOL is largely subjective, a subjective survey would seem appropriate as a means of measuring changes in QOL. We sent a 2- part survey randomly to patients currently on our program and recorded all responses. Part 1 inquired of side effects and part 2 of perceived benefits. In this paper we report the changes seen in the above-mentioned objective outcomes as well as the results of our side effects and benefits survey given to patients currently on our program.
Materials and Methods
All subjects were patients enrolled in the Cenegenics Program between February of 2000 and March of 2001. Data was collected retrospectively on enrolled patients who qualified by having not been on any hormone therapy prior to the trial period, having remained on a constant set of hormones for the study duration, having not been on any prescription drug known to affect the outcomes being measured, and having had their follow-up blood draws, dexa scan, and physical measurements taken also during the study period. Most of our patients were disqualified for one or more of these reasons. One exception to the above criteria was that women previously on estrogens and/ or progesterone or progestins were admitted. All subjects had their baseline studies done within the 3 weeks prior to commencing their program. Both baseline and follow-up blood draws were done fasting. Blood testing was routinely performed by Quest Diagnostics in Salt Lake City, Utah, but other commercial labs were sometimes used at the subject's discretion. Normal ranges for the various labs used were identical.
Subjects were initially seen at Cenegenics for a baseline evaluation that included a standard history and physical examination including measurement of WHR, breast and digital rectal examination with stool hemoccult. Pap smears and mammograms were not done but were required to be on record within the past 12 months and annually thereafter for all women on GH or estrogen. % BF, lean body mass and bone density were measured by DXA scan. Baseline DXA scanning was done by Cenegenics on a Lunar DPX-IQ Imaging Densitometer. If a follow-up scan was done at a different facility it was disqualified for difference in either technique or precise anatomical location. Baseline blood test results were available at the time of the initial visit. Subjects met for 90 to 120 minutes with a physician for the exam, evaluation of all data and formulation of a hormone program. The physician instructed the subjects on the benefits and risks of each hormone as well as potential side effects and the synergy of nutrition, exercise and hormone supplementation. Initial dosing of hormones was not formula based and was determined solely by the judgment of the physician based on his experience. Each subject met for a similar period of time with a nutritionist for a comprehensive diet analysis, explanation of the physiologic effect of a low glycemic diet, and instruction on healthy and harmful fats. Moderate intake of polyunsaturated and monounsaturated fats was encouraged without a specific requirement in grams or calorie percentage. Patients were encouraged to use green and yellow vegetables (excluding corn, carrots and beets) and the lower glycemic fruits as sole sources of carbohydrate. Sugars and starches were strongly discouraged. A calculation of daily protein requirement based on lean body mass and activity level was performed. Emphasis was placed on motivating the patient through education rather than imposing strict dietary rules. An evaluation was made of physical restrictions and/or disability, followed by the recommendation of a specific exercise plan. The subjects then met for 15 to 30 minutes with a registered nurse who instructed them on the administration of all prescribed hormones including self-injection. Subjects were encouraged to call in to speak with the physician, nurse or nutritionist at any time they had questions, doubts or symptoms. The first follow-up blood draw was scheduled 6 weeks after the initial visit. Subjects reviewed the results in a teleconference with their physician and dose was adjusted in an effort to attain or maintain the serum level in the "Cenegenics Optimal Range" (COR). The COR was arbitrarily chosen by the following guidelines: Estradiol: mid-range for the early follicular phase; Progesterone: upper normal for the follicular phase yet below normal for the luteal phase; T: upper 40% of the normal range for men (not age defined); IGF-1: upper 40% of the normal range for men and women for the age bracket of 39 to 54; DHEAS: upper 30% of the normal range for a young adult. The only drug therapy used to effect hormone levels was anastrazole, an aromatase inhibitor, used for men whose estradiol rose above the normal range with the administration of T. The dose of anastrazole was estimated with the goal of keeping estradiol levels in the upper ½ of the normal range for men. Subsequent blood draws were scheduled approximately 12 weeks after the first follow-up blood draw.
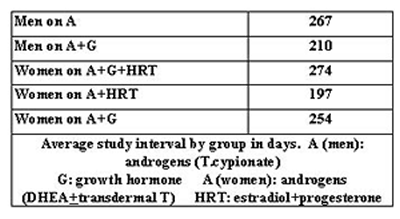
For data collection and reporting, the subjects were divided into five groups: Men on androgens (A) (D orally and T as testosterone cypionate by weekly IM injection), men on A plus G (recombinant human growth hormone by subcutaneous injection 6 mornings per week), women on A (D orally and T as compounded transdermal testosterone cream or gel) plus hormone replacement therapy (HRT) (oral progesterone plus transdermal estradiol, or triest [estradiol, estriol, estrone] or biest [estradiol, estriol]), women on A plus G, and women on A plus HRT plus G. Patients were assigned to a particular group based on their personal selection of a hormone program after consulting with the physician. Doses are not reported. Since the patients were managed according to their serum level for each hormone, the dose varied widely. The intent of the study was not to correlate the outcomes to a specific dose, but to correlate the outcomes with the change in serum level in the context of the program. The average study period was defined as the number of days from the first day of hormone therapy to the date of the last blood draw within the first 9 months of the patient's program. Since the data was collected retrospectively and the timing of the blood draw was strongly influenced by patient preference, the average study period varied for each group. It ranged from 197 to 274 days. The average study period for each group is shown in Table 1.
Table 1
RESULTS
Table 2 shows the change in serum hormone levels as well as the change in PSA for both groups of men - those on A, and those on A plus G. Estradiol level was not shown in these men because it was kept in the normal range with the use of anastrazole.
The change in levels of the various administered hormones for women are shown in Tables 3 and 4. Estradiol and progesterone levels were not followed in women who were not taking them. The normal range of testosterone, free testosterone, DHEAS and insulin-like growth factor-1 (IGF-1) were different for those aged 50 and over versus those under 50.
Table 5 shows the change in HA1C for all the groups. In addition, calculations were done to show the change in all men and all women, regardless of which hormone program they were on. We also calculated the change for all subjects, for all men and for all women, separating these three categories further into those receiving or not receiving G.
Table 6 shows the percentage change for each group in TC, LDL, HDL, TG, TG/HDL and CRR. Table 7 shows the percent change in weight, LBM, % BF and WHR in four out of the five groups. We were unable to obtain follow up data for women on A plus G.
Table 2
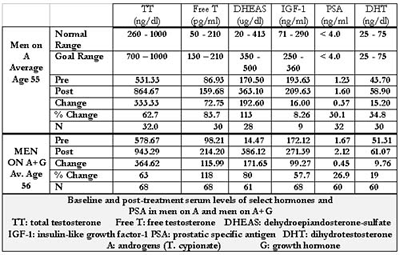
Table 3
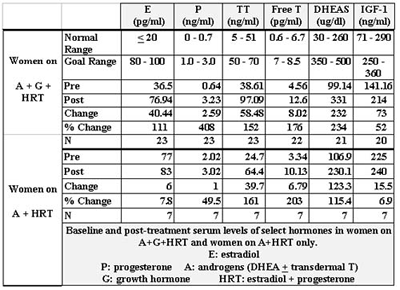
Table 4
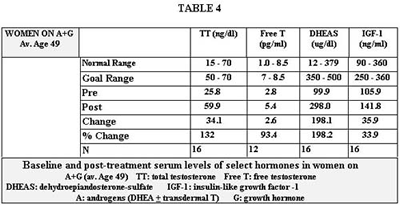
Table 5
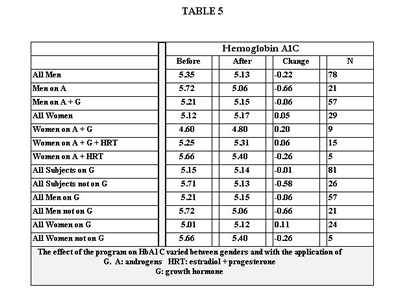
Table 6
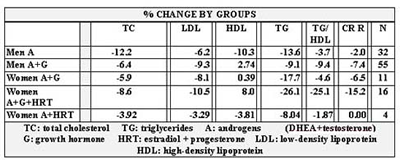
Table 7
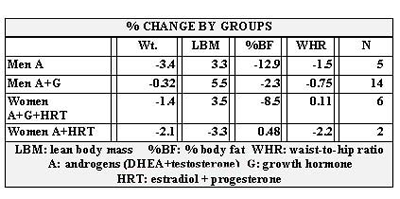
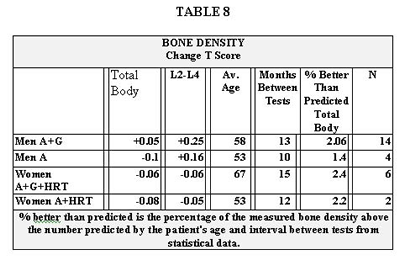
Table 8 shows the change in bone density that occurred over the course of the program in only four groups. No follow up data was available for women on A plus G. The fifth column shows the percent better than predicted of total body bone density for each of the four groups. The purpose is to show how well the patients in each category fared in comparison to the expected change in bone density matched to their age and period of time between scans. Peer reviewed papers were used to obtain a range of expected bone loss per year matched for sex and age to our groups. Based on these data, the rates of expected decline in bone density that we used in comparison to those actually experienced in our population were: for men, 1% per year; for women on A+G+HRT (average age 67), 1.5% per year; for women on A+HRT (average age 53, perimenopausal), 3% per year.
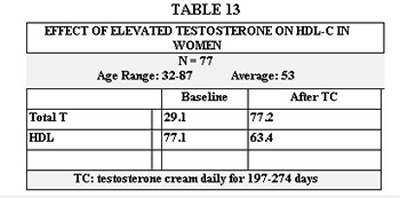
Table 13 illustrates an effect we noticed on HDL cholesterol by raising testosterone levels above the normal range in women.
Table 8
Side effects that occurred while on the program are recorded for men on Table 9 and for women on Table 10. This survey was sent to all patients on the program. The response rate was low, partly because we had only a very small window of time to receive the answers back. The survey was sent only to those who were currently on the program. It would therefore, exclude anyone who had dropped out of the program due to side effects.
Perceived benefits of the program based on a subjective survey filled out by patients currently on the program are shown on Table 11 for women, and Table 12 for men. Although statistical analysis was not done, it did appear that a majority of the women who responded positively were on growth hormone.
Table 9
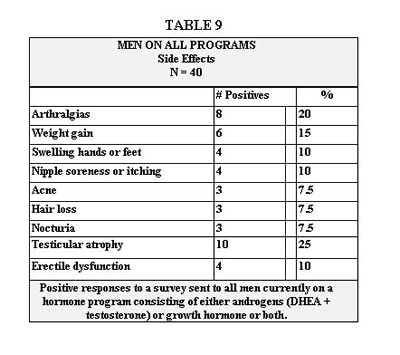
Table 10
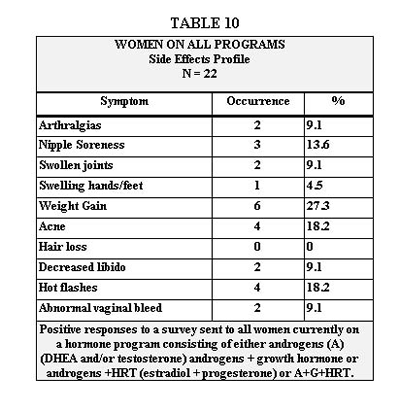
Table 11
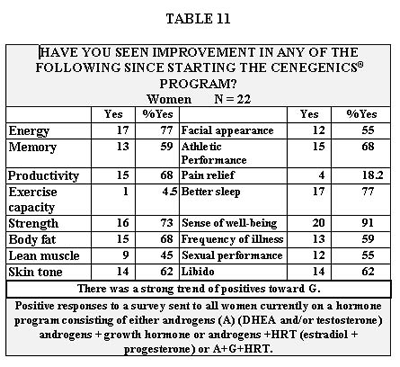
Table 12
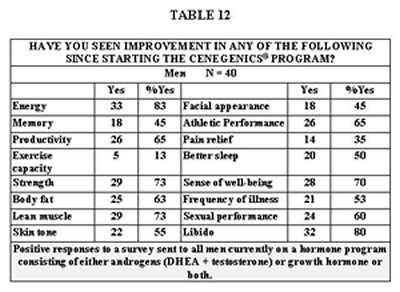
Table 13
Side effects that occurred while on the program are recorded for men on Table 9 and for women on Table 10. This survey was sent to all patients on the program. The response rate was low, partly because we had only a very small window of time to receive the answers back. The survey was sent only to those who were currently on the program. It would therefore, exclude anyone who had dropped out of the program due to side effects.
Perceived benefits of the program based on a subjective survey filled out by patients currently on the program are shown on Table 11 for women, and Table 12 for men. Although statistical analysis was not done, it did appear that a majority of the women who responded positively were on growth hormone.
Conclusion
These data support the hypothesis that the many benefits seen in controlled trials of hormone replacement, low glycemic nutrition and exercise in the realm of reduced disease risk and quality of life, can be delivered in the private practice setting with minimal side effects that are easily managed.
Discussion
The first issue of note is that attaining more youthful serum levels of the sex hormones and IGF-1 is achievable and largely predictable. We overshot both our goal and the normal range only for T and only in one group- women on A + G + HRT. This was apparently not without consequence as shown in Table 13, due to the decline in HDL. T has been implicated to lower HDL levels in women(120,121). Reducing the T dose, fine-tuning the diet, or even using cholesterol-modifying agents are options for dealing with this. Also notable is the relatively high level of HDL in these women both before and after T administration. The rise in T levels in women is partially affected by D. (122,123)
DHEAS levels were below the goal in most women as a result of dose restriction due to the occurrence of acne. This is of limited significance due to the arbitrary nature of the goal range. In no group did we achieve our goal for IGF-1. This was a function of cost, but often also, a result of adequate clinical response as perceived by the patient, at a level below the goal range, obviating the need to reach the goal range.
The substantial improvement in disease risk outcomes seen in tables 4-10 and the subjective benefit shown in tables 11 and 12 cannot be attributed to G or any single or group of hormones, or even to one modality. They can only be attributed to the comprehensive program. For example, studies without calorie restriction unanimously demonstrate a rise in HA1C with the use of G well beyond what we experienced (114-118). Yet there were at least three interventions working to lower HA1C: LGID (102,108), exercise (113), and T (7). It is gratifying that we saw a reduction in HA1C in most groups on G and only a minimal increase in women on G. Certainly our patients were consuming more calories than the subjects in Nam’s study (119) where patients on a daily restriction of 25 kcal/ kg and G lost more fat and became more insulin sensitive than those on the same diet without G.
Every category of women on G experienced, on average, an increase in HA1C, even though their percentage increase in IGF-1 was slightly less than that in men. We can speculate that they were less compliant with nutrition and exercise. Another possibility is less effect of T (7), since their serum level on the program was roughly 8.5% that of men.
In both groups of men, serum PSA increased between 27 and 30%. These percentages seem somewhat misleading since the baseline values were so low (1.23 and 1.67) and the normal range is relatively wide (0-4.0). The actual increases in PSA were only 0.37 in men on A and 0.45 in men on A + G. Our data conflict with that of Cooper (124) who saw no change in PSA in his study of 31 healthy men age 21 to 39 using intramuscular T at up to 500mg per week for 15 weeks. Although his trial was of much shorter duration than our approximate 33 weeks, his dose was up to 12 times ours. This leads us to believe that the difference in results is attributable to the subjects’ age differences. His eldest was 39 and our average age was 56. Only 7.5% of men currently on our program experienced new nocturia (Table 12). These are not necessarily the same men for whom PSA values are reported. In our 4-year history we have had only one patient drop out for urinary symptoms, a 68 year old with severe BPH who returned to the program after a trans-urethral resection.
Dihydrotestosterone (DHT) levels in our male subjects increased very modestly and remained normal. We were unable to maintain this control of DHT in our early history of using transdermal T without the aid of finasteride. No finasteride was used in any of the subjects reported herein. All our male subjects are encouraged to use saw palmetto, stinging nettle and pygeum but we are unable to report on compliance.
There was a slight increase in IGF-1 in both groups not on G, one group in each gender (Tables 2 and 3). This is likely a T and D effect. Testosterone administration in eugonadal (125) and hypogonadal (126) men has been shown to raise IGF-1. D supplementation has been shown to raise IGF-1 modestly in both men and women (127). In those on G, our post treatment IGF-1 increased only modestly, partially due to our conservative approach but most importantly because subjects were satisfied with their perceived clinical response at these modestly increased levels. If they requested a higher dose it was given provided their IGF-1 had not exceeded 360 ng/ml (upper normal for the 39 to 54 year old adult as provided by Quest Diagnostics). The dose of G ranged between 5 and 10 units per week and averaged 7. The weekly dose was divided into 6 morning injections to afford the least possible risk of suppressing the early morning spike in pituitary activity. Our approach differs from the standard endocrine procedure of evening injections in the pituitary deficient where there is little or no morning activity to suppress. Because the risks of long-term administration of G are incompletely defined, we attempt to use the lowest possible dose that reasonably satisfies the patient, with the absolute upper limit of IGF-1 at 360 ng/ml. We find we seldom need approach that level.
The improvement seen in serum lipids may be the benefit that is most shared among the various interventions. G has been shown to reduce LDL as well as TC in patients with GHD (65,76). Cuneo showed this to be true with 6 months treatment (65). In a 12-month trial, also on GHD patients, Borson-Chazot noted only a transient improvement in LDL and TC at 6 months with return to baseline at 12 months, yet reported a decrease in carotid intima-media thickness in the same group at 12 months (77). Our trial ended between 6 and 12 months, consistent with the interval where improvement in TC and LDL was seen in both studies.
O’Neal, however, saw improvement in TC and LDL after 24 months of G in GHD patients(78). He did, however, note an increase in lipoprotein (a), which we did not measure. The improvement in serum lipids in men was also likely supported by T. (17,18,22-24,26)
Table 7 illustrates that weight and %BF dropped and LBM increased in all subjects except women on A + HRT. We’re unable to explain the increase in %BF and decrease in lean body mass in women on A + HRT, other than that follow-up measurements were obtained in only two subjects. No one from the group of women on A + G was available for follow-up measurements. The greatest rise in LBM was seen in men on A + G, as would be expected (1,5,6,47-51). WHR decreased in three of four groups, and increased negligibly in women on A + G + HRT. We were pleased with the overall effect on body composition, particularly if we overlook the group with only two subjects. Men on A lost more body fat than men on A + G. This is inconsistent with the data from the NIA data that showed an additive effect of the two hormones on fat loss in elderly men.(128) One explanation is that in the NIA study there were no components of nutrition or exercise, which clearly can have a profound differential influence among groups, particularly given the small numbers in our groups.
Table 8 shows the improvement in bone density of 1.4 to 2.4% over the predicted for four groups. Again we were unable to collect follow-up data on women on A + G. Although the results appear mixed when reading the change in T score, one must take into account normal bone loss for age and sex over the given time studied. Most studies report a 1% annual loss for men and 1 to 3% for women with the exception of women in the perimenopausal period where bone loss is reported to be 3% or more per year (129-132). We therefore, used 1% as the expected bone loss per year for all groups of men and 1.5% for women except women on A + G. Since those women averaged 53 in age, we used the low end of the perimenopausal expected decline, or 3%. We factored the expected bone loss per year over the number of months between DXA scans.
Our side effect survey ( tables 9 and 10) pertains to a different group of subjects than those discussed above, although there was some overlap. It was sent randomly to patients currently on our program and therefore excluded those who had dropped out, making it less objective. The occurrence of testicular atrophy in 25% of men was the most frequent adverse event. This was surprisingly well tolerated because men were forewarned but also because they were so appreciative of the benefits of T. Human chorionic gonadotropin (HCG) was used to reverse it. The benefit of HCG was incomplete but substantial. Arthralgias were the second most common at 20% with swelling of hands or feet at 10%. These are well known side effects of G related to its antinatruretic effect and are dose dependent (60,65,83,128); they were easily reversed in our population by abstaining from G for 1 week and resuming at a dose reduced by 15%. Weight gain occurred in 15% of respondents. This fits with the antinatruretic effect of G but is likely also related to the anabolic effect of T (1,5,6). Nipple discomfort is likely related to the rise in estradiol (E2) that often accompanied the rise in T level. It was easily controlled by bringing E2 back down to the upper normal range with a very low dose aromatase inhibitor. 10% of our patients experienced some level of erectile dysfunction while on a program. This is less than or equal to the norm expected for men over 40.(133,134) The National Health and Social Life Survey reported a prevalence rate for erectile dysfunction of 11% for ages 40 to 49 years and 18% for ages 50 to 59 years.(134) In our practice new erectile dysfunction has never proven to be more than transient and therefore is thought to be either psychological or related to fluctuations in T or estradiol levels. Acne, seen in 7.5%, in our experience is a common side effect of D and is dose dependent. Nocturia and hair loss might both be considered related to a rise in DHT and PSA, although in our study group the rise in both was slight and they remained normal (Table 2).
Table 10 represents symptoms reported by women on our program that could represent side effects. The most common at 27.3% was weight gain. To this we assign the same discussion as for men in the above paragraph. Looking at the data from our other study population shown in Table 10, we see that of the 8 women, there was a net loss in BF% and a net gain in LBM. This would support the likelihood of weight gain being a result of gains in LBM and water. The next most common symptom was acne, which we discussed in the above paragraph. Hot flashes, abnormal vaginal bleeding and nipple soreness can usually be attributed to physiologic response to non-optimal levels of estradiol or progesterone. They require measurement and adjustment in dosage followed by the appropriate work-up if unsuccessful, the scope of which is beyond this paper. Swollen joints, swelling of hands and feet and arthralgias we would again attribute to fluid retention from G, which is discussed in the above paragraph. Decreased libido was reported by 9.1% of women. We’re at a loss to explain this. As you can see from Table 11, libido increased in 62% of these same women and sexual performance improved in 55%. T is credited in a number of studies to enhance libido and sexual performance in postmenopausal women
Tables 11 and 12 represent the positive side of our survey. These data speak for themselves and detailed discussion of their relation to individual aspects of our program would be redundant. Suffice it to say that we were gratified to see the high percentages of patients who felt they had improved in so many outcomes so critical to quality of life.